User manual of
ClustEx2
(2) Basic usage
(3) Output files
(5) Advanced usage
(6) Tips for Adjustable parameters
(7) R environment setting on Windows
(8) Example Usage (using our test data)
Introduction
Users need
ClustEx2 mainly to see how the set of genes, namely seed genes, form connected
subnetworks or modules in a known physical interaction network, such as
protein-protein interaction network.
Installation requirement
The installation requirement is for users who would
like to use the command line interface of ClustEx2. For those who are not
familiar with command lines, please use the web user interface of ClustEx2 for
simple application.
Hardware requiremnet
The requirement of a user’s computer is depended on
the size of input gene network. Generally, if there are more than 8,000 genes
in the network, users need to compile a 64 bit version of ClustEx2, and the
memory should be no less than 4G as well as a powerful CPU. Otherwise, a 32 bit
version of ClustEx2 would be enough, with no less than 2G memory. However, 64
bit version along with 8G memory are recommended.
ClustEx2 runs in the cmd or shell environment. On
Windows, users are welcome to download the compiled version (Cygwin compiled).
On linux, users are welcome to install their own ClustEx2. Due to the cost of
computation, we recommend users to run ClustEx2 on linux with a
high-performance computer.
Software dependence
Users also need to install R, for a figure drawing step is needed to
visualize key features during clustering process. Also Cytoscape is needed to visualize results of
ClustEx2. Fortunately the two software packages are popular and easy to use.
Time cost
The main factor that affects running time is the
number of genes in the network. When the gene network contains about 5,000
genes, it usually takes about 20 to 30 minutes with an i5-2300 CPU while 2 to 3
hours when there are about 10,000 genes to obtain final results in the runtime
of Windows 7. No matter how many seed genes there are, calculating gene
importance scores usually costs several minutes due to matrix inversion. The
density-based clustering method which determines each gene’s module one by
one is also time efficient.
Parameter tuning is to run the density-based method several times and it adopts
the technique of OpenMp multi-thread calculation. Estimating gene-gene
similarity scores occupies most of the running time. Our way of implementing
the diffusion kernel is based on eigenvalue decomposition, however, it is still
more time efficient than calculating the shortest path for any pair of genes in
the network.
How to obtain runnable binary files
(1) Compile binary files on
linux
>
chmod u+x install.sh
>
./install.sh
The
file “clustex2” is the runnable binary file.
(2) Directly runnable binary
file in linux
>
chmod u+x clustex2
Run
the bin file “clustex2” directly.
(3) On Windows
Keep
all the DLL files, including cyggcc_s-1.dll, cyggomp-1.dll, cygstdc++-6.dll and
cygwin1.dll in the same directory with the binary file clustex2.exe. Directly
run this binary file.
Usage
Users who run ClustEx2 for the first time can directly
check (1) Input file format, (2)
Basic usage, (3) Output files and then (4) Output visualization successively.
Users who have run ClustEx2 and want to use it for
several times need to further check (5) Advanced usage.
Experienced users of ClustEx2 who would like to set adjustable parameters can
check (6) Tips for adjustable parameters.
The output files of ClustEx2 are described in (3). There is a help on how to use R in Windows CMD in (7).
As with the gene network, in the latest package
release we provide a protein-protein interaction network extracted from STRING,
along with two data-specific protein-protein interaction networks. These
networks are in our test data in the software packages (Linux and Win 64bit).
The command lines of running ClustEx2 for these test datasets are in (8). Users are encouraged to prepare their own gene
network with edge weights.
1) Seed gene file
Seed
genes are defined as a subset of the candidate genes that have weight larger
than a threshold by users themselves; or defined as all the candidate genes.
Seed gene file is denoted as <seed_genes> in the following explanation of
usage. In the file, a header line is NECESSARY. Genes can have weights or not and
therefore two kinds of candidate gene files are accepted by ClustEx2 and the
corresponding two examples of this file are as follows:
i)
No weights: a header line and 1 column.
Gene
14
20
ii)
Have weights: a header line and 2 columns. The 2 columns are
tab delimited.
Gene(TAB)Weights
14(TAB)0.1
20(TAB)0.2
2) Gene network
ClustEx2
offers a gene network in the software package which is from STRING database,
with edge scores larger than 0.9. The edge scores are the similarities of the
linked genes, NOT distances. Users are welcome to provide their own gene networks.
In the file, a header line is necessary. Two kinds of gene network files are
accepted by ClustEx2 and the corresponding two examples are as follows
i)
NO weights: a header line and 2 columns. The 2 columns are
tab delimited. For example:
Gene(TAB)Gene
14(TAB)20
ii)
Have weights: a header line and 3 columns. The 3 columns are
tab delimited. For example:
Gene(TAB)Gene(TAB)Weights
14(TAB)20(TAB)0.9
Explanations: To find the gene modules
formed by candidate genes and their close neighbor genes in a given physical
interaction network, such as protein-protein interaction network, there are 3
steps you need to run: The first two steps 1) and 2) create some middle results
which are the input files or parameters for step 3). The “gene importance
calculation” and “gene-gene similarity calculation” are both solved in step 1)
here and “Gene module finding” is split into step 2) and 3) here. To start a
job, users are welcome to name it with a <job_name>.
1) Calculate gene-gene
similarities (-D), namely diffusion kernel, and gene importance (-G).
Explanations: This step outputs 2 files
that are used in the following two steps 2) and 3).
Firstly
gene-gene similarity, namely <diffusion_kernel>, which is gene network
specific.
Secondly
gene importance, namely <gene_importance>, which is seed gene specific.
Command lines:
Users
can define seed genes as a subset of candidate genes, or as all the candidate
genes.
i.
Seed genes as candidate genes
./clustex2
--gene_list <seed_genes> --network <gene_network> -D -G -j <job_name>
ii.
Seed genes as a subset of candidate genes when they have
weights. Seed genes are those with weights larger than some threshold
<weight_threshold>
./clustex2
--gene_list <seed_genes> --network <gene_network> -D -G -j
<job_name> -w <weight_threshold>
2) Record the clustering
process, which is output by option -P. Determine the largest module size and
neighborhood. (NECESSARY STEP)
Explanation: This step is NECESSARY to
determine final module sizes which are the input parameter settings of step 3),
along with the parameter “neighborhood” if users are not willing to use its
default value 0.1. Here we use the size of the largest module to stop
clustering, that is to say, we can directly control the largest module size.
Command lines:
To
obtain figures similar to Figure 1, user need to run command lines as follows:
./clustex2
--gene_list <seed_genes> --network <gene_network>
--diffusion_kernel <diffusion_kernel> --gene_importance
<gene_importance> -P <level(1,2, 3, 4)> -j <job_name>
-P
records clustering processes in a file <neighborhood_TXT>. Please use the
R script “draw_curves_neighborhood.R” in the package.
Rscript
draw_curves_neighborhood.R <neighborhood_TXT> <neighborhood_PDF>.
Principles to control outputs:
The principle to determine the size of
the largest module and neighborhood is shown in Figure 1. Neighborhood means
that if the current clustering gene G1 is in the neighborhood of a clustered
gene G2, then the G1 is in the module which G2 belongs to. The following
procedures help to determine these two parameters: (1) the neighborhood needs
to be small, but not too small that almost every gene forms a module by itself,
as in Figure 1(A): the largest module only expands to include 4 genes (2) the
neighborhood should not be too large that almost all genes form one module, as
in Figure 1(C): the largest module almost clusters every gene. The neighborhood
can range from 0.05 to 0.2. (3) When we choose several alternative
neighborhoods, we should observe the clustering processes under the corresponding
neighborhoods. In Figure 1(B), we want to control the module size to be around
250 with seed gene fraction equaling to about 0.4. Users are welcome to control
the module size as long as it is satisfactory.
Through our experience of module identification,
neighborhood can range from 0.05 to 0.2. Neighborhood smaller than 0.05 is too
small. Neighborhood larger than 0.2 outputs modules with modules which do not
have rather high intra-cluster similarities. ClustEx2 set the default value of
neighborhood as 0.1.
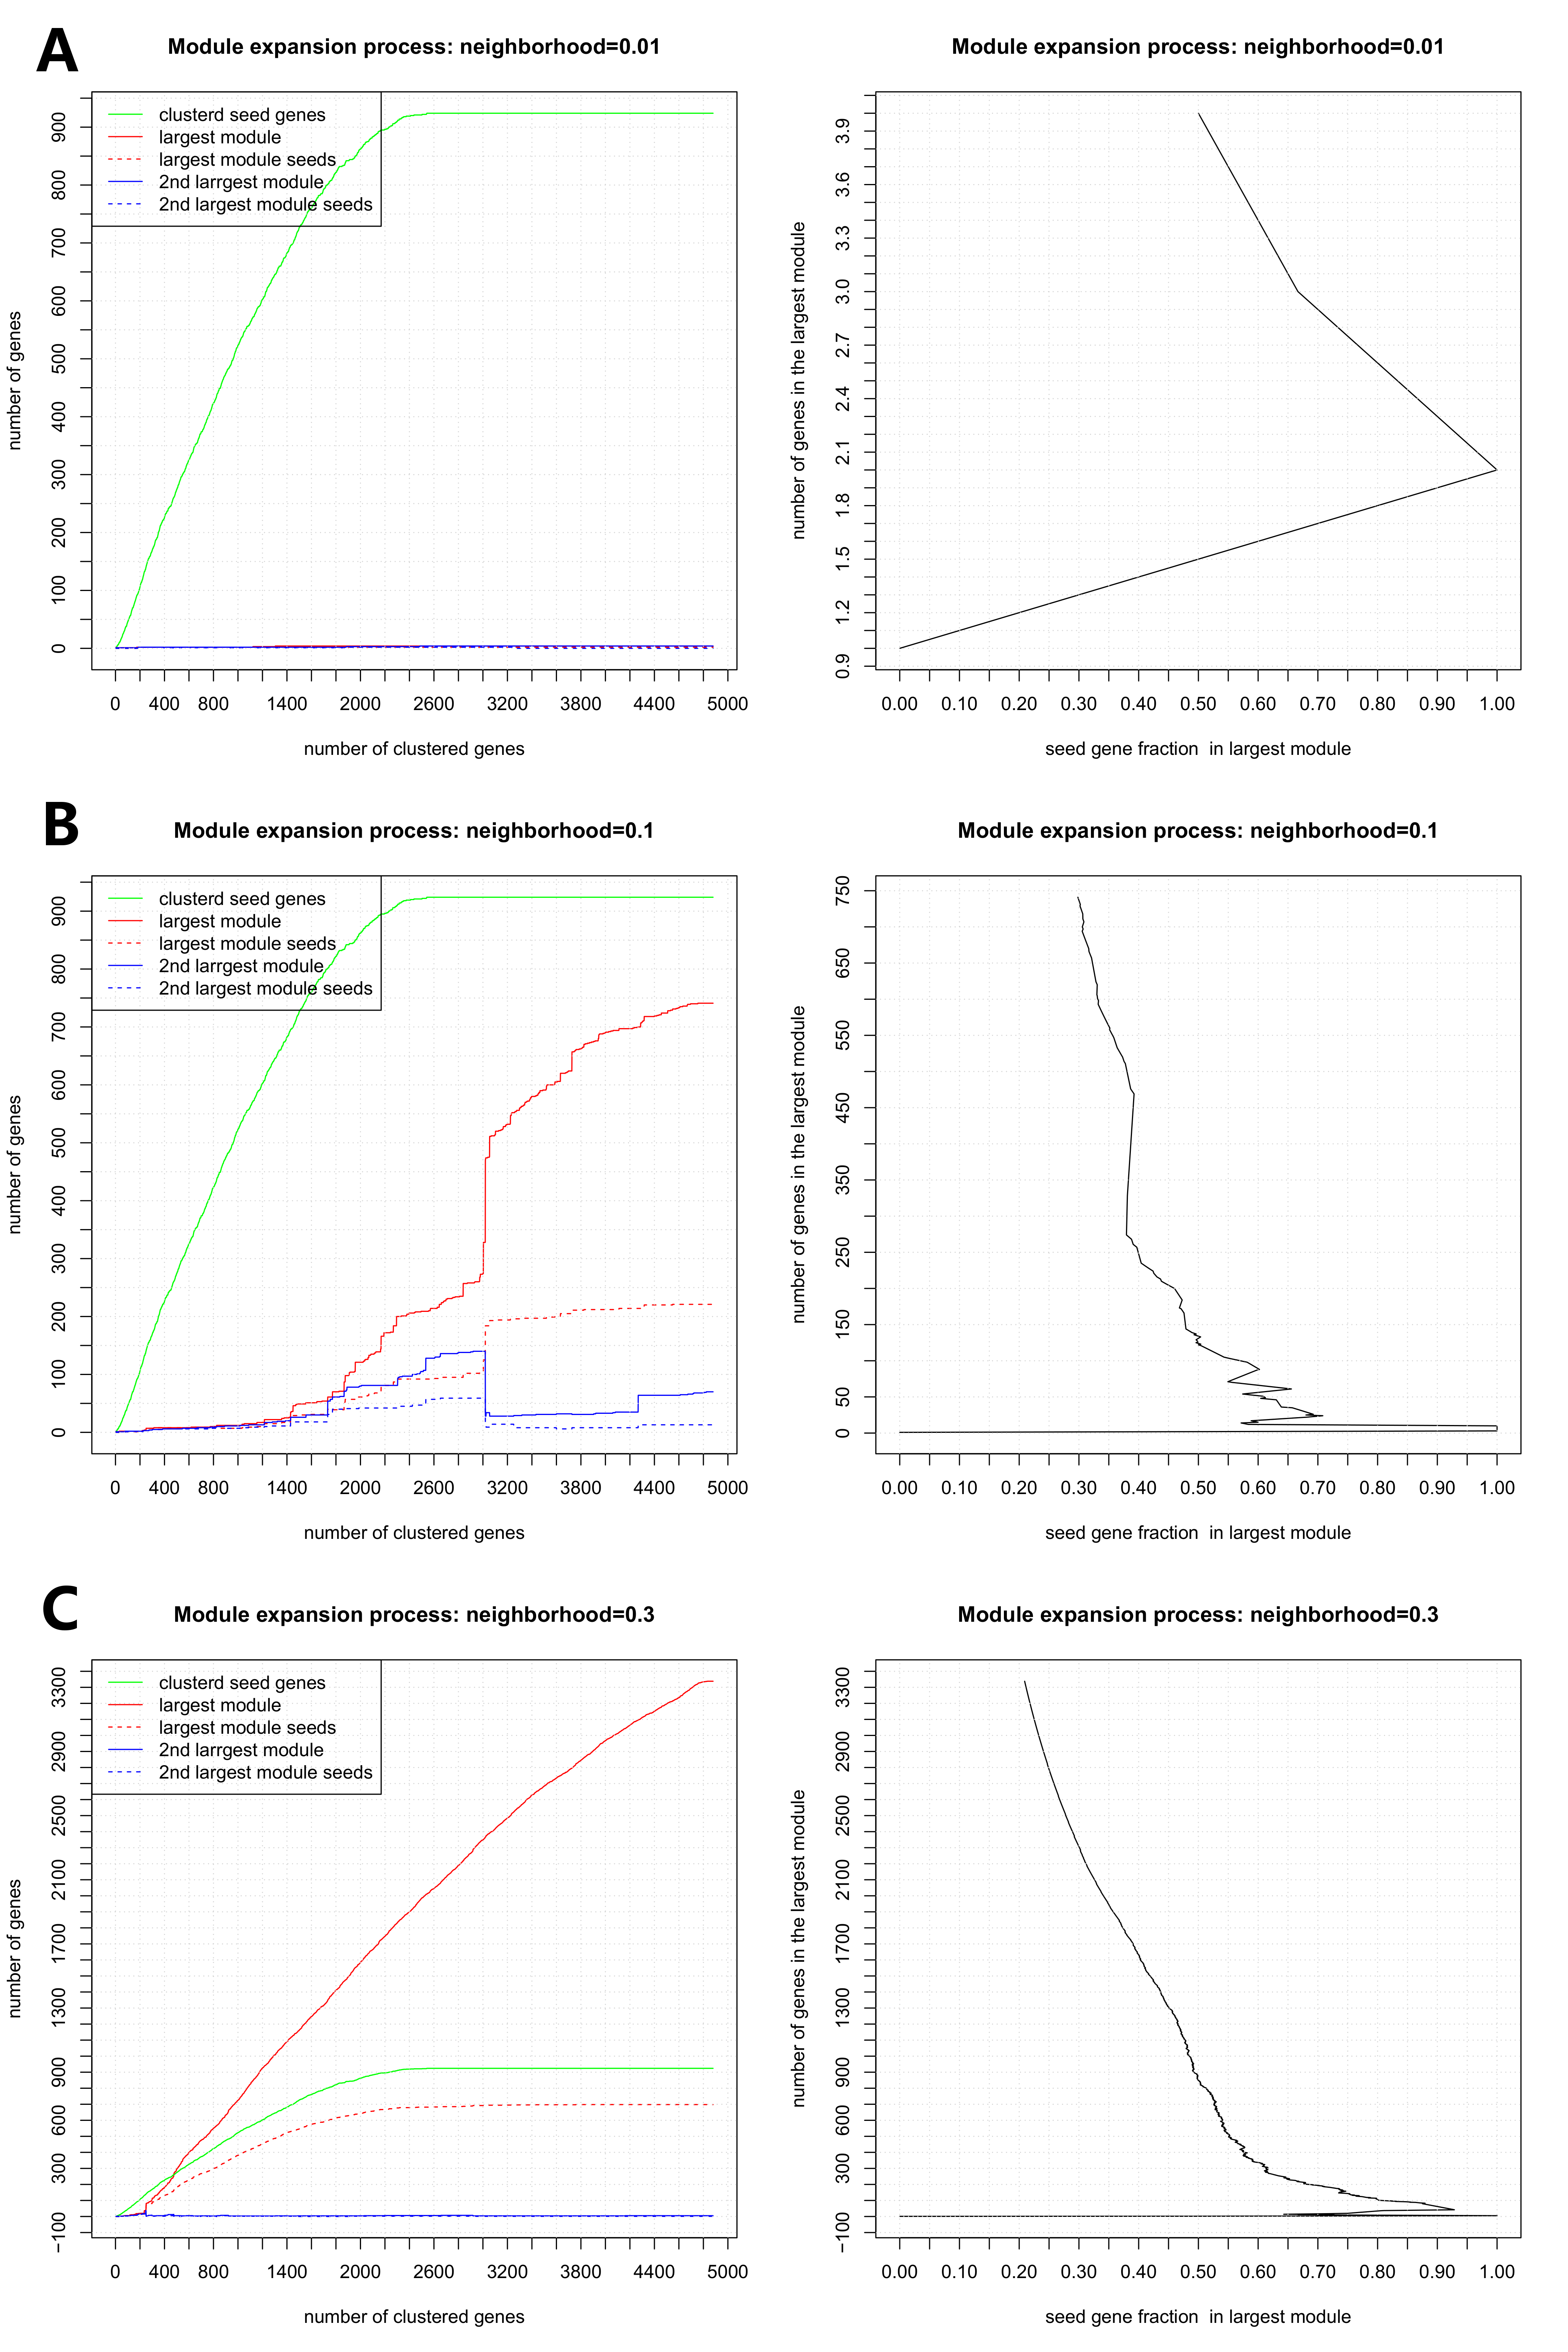
Figure 1 Clustering
process under three different neighborhoods
It should be mentioned that the input option of the
package for tuning the parameter “neighborhood” is -P, which ranges from level
1 to level 4. The parameterization of neighborhood ranges from 0.01 to 0.99,
with a step of 0.01. When the level of -P is higher, more values of
neighborhood are used for obtaining key features during module expansion. For
example, when -P is level 4, all values from 0.01 to 0.99 with the step of 0.01
are used for clustering.
3) Clustering (-C) genes with
-s (--size ) and -n (--neighborhood) to identify gene modules
Explanations: ClustEx2 identify gene
modules (-C) and output three files which can be visualized by Cytoscape. The
visualization procedure is in “(4) Output visualization”
and the output files are in “(3) Output files”.
Command lines:
i.
Seed genes as candidate genes, setting neighborhood or not.
./clustex2
--gene_list <seed_genes> --network <gene_network>
--diffusion_kernel <diffusion_kernel> --gene_importance
<gene_importance> -C -s <size> -j <job_name>
./clustex2
--gene_list <seed_genes> --network <gene_network>
--diffusion_kernel <diffusion_kernel> --gene_importance
<gene_importance> -C -s <size> -j <job_name> -n
<neighborhood: 0~1>
ii.
Seed genes as a subset of candidate genes when they have
weights. Seed genes are those with weights larger than some threshold
<weight_threshold>
./clustex2
--gene_list <seed_genes> --network <gene_network>
--diffusion_kernel <diffusion_kernel> --gene_importance
<gene_importance> -C -s <size> -j <job_name> -w
<weight_threshold>
./clustex2
--gene_list <seed_genes> --network <gene_network>
--diffusion_kernel <diffusion_kernel> --gene_importance
<gene_importance> -C -s <size> -j <job_name> -w
<weight_threshold> -n <neighborhood: 0~1>
Explantions: The option -j, --job is
used here to give clear indication of middle results, namely diffusion kernel
and gene importance, and final results including three files. A prefix is
needed for naming the output files in every step and if users do not input a
job name, the software will substitute with the local system time.
Files:
For example, if we set -j as TNF, the
five files are named as follows.
1) The middle results:
Diffusion kernel: TNF_diffusion_kernel_0.01.txt;
TNF is the job name, 0.01 is the default -d, --diffusion_beta.
Gene importance:
TNF_gene_importance_0.5.txt; TNF is the job name, 0.5 is the default -r,
--restart_prob.
Clustering process:
TNF_neighborhood.txt;
2) The final results:
The module file (with edges):
TNF_modules_300_0.1.txt: 300 is the --size, 0.1 is the --neighborhood.
The module file (without edges):
TNF_clusters_300_0.1.txt.
The gene file: TNF_genes_300_0.1.txt.
Abandoned genes:
TNF_seed_genes_not_in_network.txt
Explanations:
There are
three output files that are suitable to be used for visualization with Cytoscape. Here are the process of using
Cytoscape 3.0.1 with the three output files as input.
Operations:
First input the module file (with
edges), such as “TNF_modules_300_0.1.txt”, and choose the Prefuse Force
Directed layout, notice that the third column is module number, though it does
matter whether this module number is big or small. The first and second column
represent two genes which form an edge in the gene network.
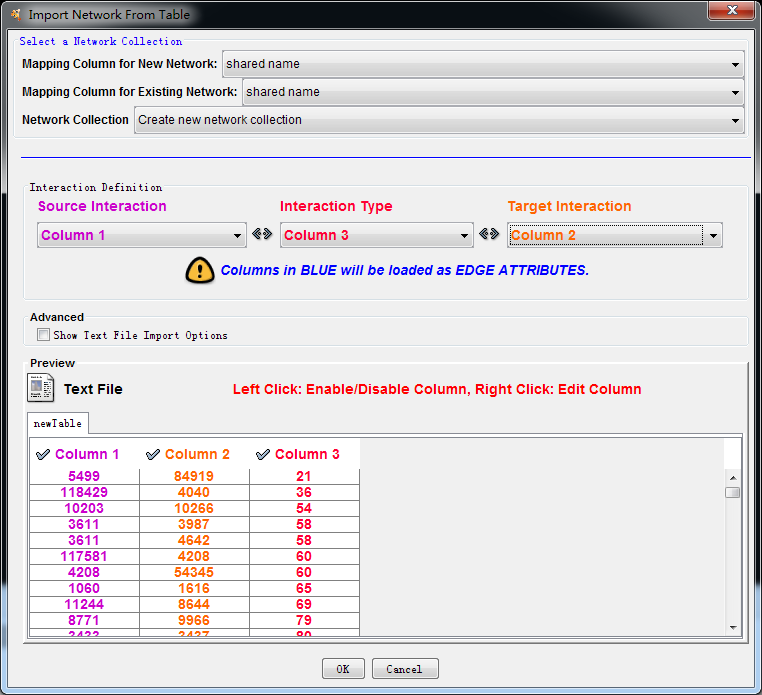
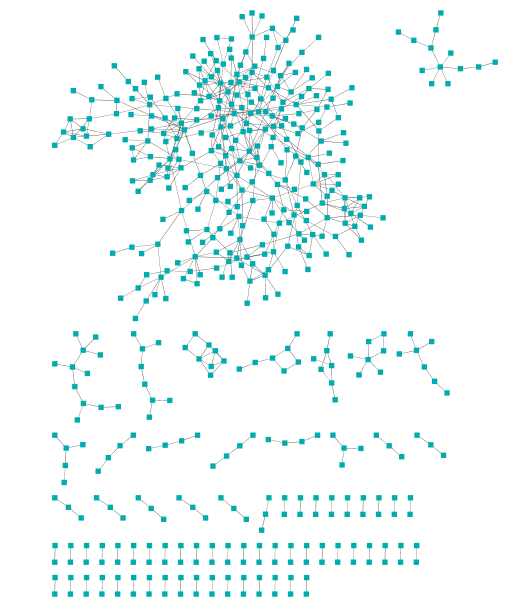
Figure 2. Visualiza modules with Cytoscape
Secondly input the gene file, such as “TNF_genes_300_0.1.txt”, with the
option “Import Tables”. The file means that each gene (1st column)
belongs to a module (2nd column) is a seed gene or not (3rd
column, 1 as seed gene). In the “VizMapper”, choose “Node fill color” with
“Column 3” and “Discrete mapping”.


Figure 3. Input genes with module and seed gene annotaion
Choose red for 1, which represents the seed genes in the gene set.
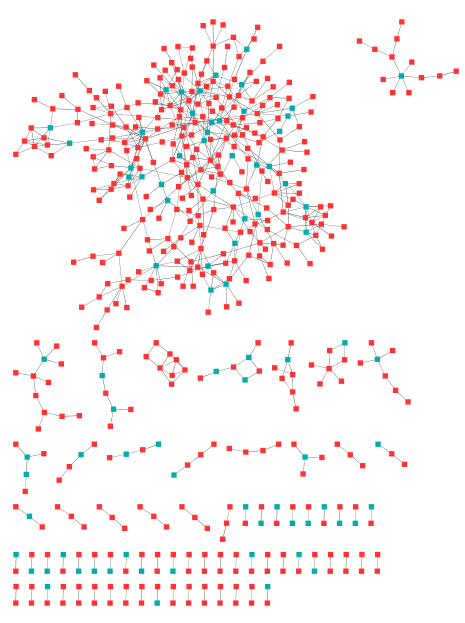
Figure 4. Modules with red dots as seed genes.
Thus
we can see a dominant module with most seed genes in it.
If users want to extract a module of
genes, s/he can refer to the module file (without edges), for example
“TNF_clusters_300_0.1.txt”.
1) If users want to use one
gene network repeatedly with different sets of seed genes, and once the gene
network specific diffusion kernel (-D step) of this network has been calculated
and saved automatically, -D is substituted by --diffusion_kernel for the
remaining steps to identify gene modules.
./clustex2
--gene_list <seed_genes> --network <gene_network>
--diffusion_kernel <diffusion_kernel> -G -S -j <job_name>.
Notice
that the diffusion kernel must be exactly calculated from the gene network,
with the same weights.
2) If users happens to choose
an unsatisfied stop time (-s, --size), it’s convenient to cluster genes without
having to calculate seed genes specific gene importance (-G) and gene network
specific diffusion kernel (-D) again, which saves more computation resources.
The following command line is used for this kind of situation.
./clustex2
--gene_list <seed_genes> --network <gene_network>
--diffusion_kernel <diffusion_kernel> --gene_importance
<gene_importance> -C -s <size> -j <job_name>
(6) Tips for Adjustable parameters
There
parameters can be adjustable, including --restart_prob, --diffusion_beta and
--neighborhood.
1) -r, --restart_prob
To
balance the information between gene set and gene network topology, the gene
importance calculation needs the parameter this parameter to be set between 0
and 1. The larger this parameter, the more information of the gene set will be
used and vice versa. For example, if we set it to 0.9, most important genes
have a high fraction of seed genes; if we set it to be 0.1, most important
genes have a low fraction of seed genes. However, for clustering there are no
objectives to set -r as optimal, and thus we set it 0.5 by default. The following
command is one situation of set it to be 0.9, supposing diffusion kernel have
been calculated:
./clustex2
--gene_list <seed_genes> --network <gene_network>
--diffusion_kernel <diffusion_kernel> -G -r 0.9 -j <job_name>
2) -d, --diffusion_beta
To
calculate the diffusion kernel of gene network, the parameter
-d/--diffusion_beta can be set to set larger than 0. The default value is 0.01.
(7) R environment setting on Windows
After
downloading R from www.r-project.org and
installing it, users need to add Rscript.exe to system path. For example, if
you install R in C:\Program Files\R\, you need to add “C:\Program
Files\R\R-2.15.3\bin” to system path. R 2.15.3 is an R version used by the
author.
(8) Example usage (using our test data)
Test dataset I: TNF-dataset
%%%%%%%%%%%
Input
file:
<candidate_genes>:
test_data/TNF/TNF_de_genes_0923.txt
<gene_network>:
test_data/TNF/string0.9_gse9055_tnf_final.txt
%%%%%%%%%%%
Basic
Usage
%%%%%%%%%%%
steps:
1.
define seed genes as a subsut of candidate genes, calculate gene-gene
similarity (-D) and gene importance (-G) (This step is time consuming!)
pwd:
clustex2.0/
./clustex2
--gene_list test_data/TNF/TNF_de_genes_0923.txt --network
test_data/TNF/string0.9_gse9055_tnf_final.txt -G -D -P 1 -j TNF -w 1
2.
determine the largest module size (or plus neighborhood)
Rscript
draw_curves_neighborhood.R TNF_neighborhood.txt TNF_neighborhood.pdf
3.
identify gene modules
./clustex2
--gene_list test_data/TNF/TNF_de_genes_0923.txt --network
test_data/TNF/string0.9_gse9055_tnf_final.txt --diffusion_kernel
TNF_diffusion_kernel_0.01.txt --gene_importance TNF_gene_importance_0.5.txt -C
-n 0.03 -s 350 -j TNF -w 1
Test dataset II: miR_410 dataset
%%%%%%%%%%%
input
file:
<candidate_genes>: test_data/miR-410/sig.target.txt
<gene_network>:
test_data/miR-410/string0.9_corr.txt
%%%%%%%%%%%
Basic
Usage
%%%%%%%%%%%
1.
define seed genes as all the candidate genes, calculate gene-gene similarity,
gene importance (This step is time consuming!)
pwd:
clustex2.0/
./clustex2
--gene_list test_data/miR-410/sig.target.txt --network
test_data/miR-410/string0.9_corr.txt -G -D -P 1 -j miR_410
2.
draw the clustering process curves
Rscript
draw_curves_neighborhood.R miR_410_neighborhood.txt miR_410_neighborhood.pdf
3.
identify gene modules
./clustex2
--gene_list test_data/miR-410/sig.target.txt --network
test_data/miR-410/string0.9_corr.txt --diffusion_kernel
miR_410_diffusion_kernel_0.01.txt --gene_importance
miR_410_gene_importance_0.5.txt -C -s 50 -j miR_410
Option descriptions
|
Options: steps choice |
Parameter type and range |
Usage explanation |
|
-G, --gene_importance _calc |
|
calculate genes importance |
|
-D, --diffusion_kernel_calc |
|
calculate the diffusion kernel (gene-gene similarity) of the network |
|
-P, --parameter_greedy_search (optional) |
[integer] -P = 1,2, 3 or 4 |
suggests inputs for clustering in four levels namely 1, 2, 3 and 4. If -P=4, the value of neighborhood ranges from 0.01 to 0.99 with a step of 0.01; -P=3, from 0.01 to 0.3, step 0.01; -P=2, from 0.01 to 0.98, step 0.02; -P=1, from 0.05 to 0.95, step 0.05 |
|
-C, --clustering_calc |
|
cluster genes and output modules |
Notice -G and -P demand high computing resources, both memory and time. Memorize “GDP” helps you running command lines.
|
Options: adjustable parameters(optional) |
Parameter type and range |
Usage explanation |
|
-r, --restart_prob |
[double] 0 < -r < 1 |
set restart probability for random walk, from 0 to 1,default 0.5 |
|
-d, --diffusion_beta |
[double] 0 < -d |
diffusion kernel parameter, default is 0.01 |
|
-n, --neighborhood |
[double] 0 < -n < 1 |
set neighborhood when -C is on, default is 0.1 |
|
Options: threshold settings |
Parameter type and range |
Usage explanation |
|
-w, --weight_threshold (optional) |
[double] 0 < -w < max(weight) |
set a threshold to extract seed genes from candidate genes when given initial gene weights |
|
-s, --size |
[integer] 0 < -s |
Stop clustering, with --size as largest module size, when -C is on |
|
Options: basic Input/Output |
Parameter type |
Usage explanation |
|
-j, --job (optional) |
[string] |
Job ID (if not input, the time of submitting command lines will be the ID) |
|
--diffusion_kernel |
[string] |
Input diffusion kernel file, one of ClustEx2's middle results, input when -P or -C is on |
|
--gene_importance |
[string] |
Input gene importance score file, one of ClustEx2 middle results, input along with --diffusion_kernel |
|
--gene_list |
[string] |
input the candidate gene list file |
|
--network |
[string] |
input the gene network file |
Error message
Users might run into some errors reported by ClustEx2. We list the error messages of ClustEx2 here.
|
Error message |
Explanation |
|
Did not open up the file containing PPI network, please check again! |
Fail in opening up the gene network file! |
|
Wrong format of network file! |
Gene network file contains neither 2 nor 3 columns |
|
Cannot open the file to output the diffusion kernel! |
Fail in opening up a text file to output the diffusion kernel file or gene-gene similarity file |