Search Gene Summary
Below is the summary of your gene list. The NCBI official gene symbols and IDs are used.
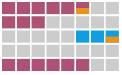
OncoGrid
This section summarizes somatic mutations, fusions, CNAs on an OncoGrid plot for your searching genes. Some important clinical traits are also listed on the plot. Correlation analysis can be conducted here by selecting a clinical trait and an affected gene. Affected gene is a gene with at least one mutation, fusion or CNA (HOMDEL and AMP only) in a sample.
View gene characteristics by clinical types
Choose Clinical.
Choose Gene.
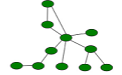
Co-Expression Network
This gene co-expression network is constructed based on all datasets by Fisher’s combination of corrected Spearman correlation p-values. Specific thresholds are used for generating the whole network. The genes are restricted to protein network data (incl. distinction: direct vs. interologs) in STRING. A two-step network is extracted from the whole network. This two-step network consists of genes that are directly correlated with the query gene, as well as genes that are correlated with those first-order correlated genes.