Contributed by Tsinghua University, National Center for Liver Cancer & Shanghai Eastern Hepatobiliary Surgery Hospital
Qiuyu Lian*, Shicheng Wang*, Guchao Zhang, Dongfang Wang, Guijuan Luo, Jing Tang, Lei Chen#, Jin Gu#.
About HCCDB
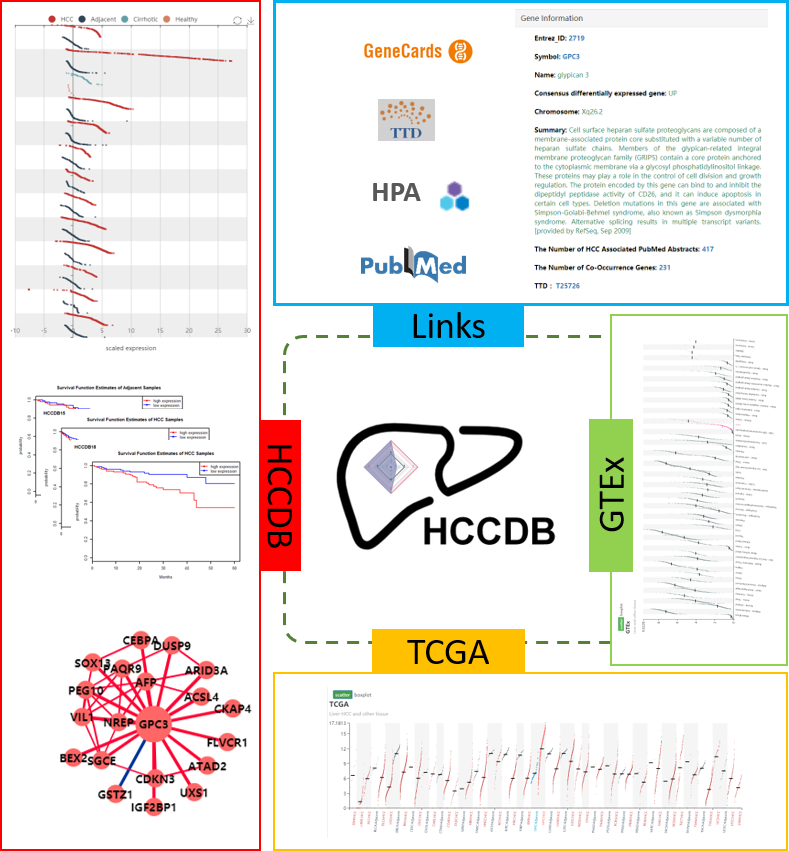
Hepatocellular carcinoma (HCC) is highly heterogeneous and is one of the most common cancer types worldwide. To guarantee repeatability of identified gene expression patterns and comprehensively annotate the transcriptomes of HCCs, we carefully curated 15 public HCC expression datasets with up to about 4000 clinical samples and developed HCCDB to serve as a one-stop online resource for exploring HCC gene expressions with user-friendly interfaces. The global differential expression landscape of HCC was established by analyzing the consistently differentially expressed genes across multiple datasets. And a 4D metric was proposed to fully characterize the expression pattern of each gene by integrating data from The Cancer Genome Atlas (TCGA) and Genotype-Tissue Expression (GTEx). To enable a comprehensive understanding of gene expression patterns in HCC, HCCDB also provides third-party database links to drug, proteomics and literatures, and graphically displays the results of several useful computational analyses, including differential expression analysis, tissue-specific and tumor-specific expression analysis, survival analysis and co-expression analysis. The database is freely accessible at http://lifeome.net/database/hccdb.
About Method
The archived expression datasets
In the current database release, we archived 15 public HCC gene expression datasets containing totally 3917 samples . For 13 microarray datasets, probe values (log2 intensity) and probe annotations were extracted from raw files downloaded from Gene Expression Omnibus (GEO ) database. Multiple probes mapped to a single gene (i.e., unique Entrez gene ID) were collapsed as their medians. For the two remaining RNA-seq datasets, Liver Hepatocellular Carcinoma Project of The Cancer Genome Atlas (TCGA-LIHC) and Liver Cancer - RIKEN, JP Project from International Cancer Genome Consortium (ICGC LIRI-JP), we took the normalized read counts for log2 transformation. Among the 15 datasets, 12 datasets contain both tumor and the adjacent normal samples, whereas only tumor samples are available for the three remaining datasets. Clinical information, such as tumor stages and survival time, was also collected if available.
We also integrated the expression data of 9755 tumor samples covering 35 tumor types from TCGA and 11,688 normal tissue samples covering 54 tissue types from GTEx (v7) to comprehensively annotate the expression patterns of each gene.
Identification of consistently differentially expressed genes
To identify consistently differentially expressed genes in HCC, twelve datasets with adjacent samples were used. The function t test in R was taken to detect whether there existed significant difference of gene expression between tumor samples and adjacent samples in each dataset, followed by Benjamini-Hochberg correction. Genes that were measured in at least eight datasets and significantly differentially expressed (adjusted P < 0.001 and |log_2FC | > 0.6) in at least half of the datasets containing the genes were identified as consistently differentially expressed genes.
Definition of a 4D metric for summarizing gene expression patterns
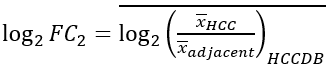
We proposed a 4D metric based on log fold-change to characterize the expression patterns of each gene. With x denoting the gene expression values in subscripted samples from a certain resource, four metrics are defined in the following way:
1) liver-specific metric, quantifies the specificity of a gene in liver compared with other tissues:
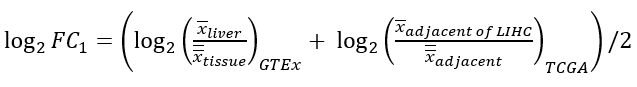
2) deregulation metric, measures the deregulation extent of a gene in HCCs compared with adjacent samples:
3) tumor-specific metric, quantifies the specificity of a gene in HCCs compared with other tissues:
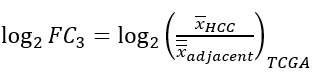
4) HCC-specific metric, denotes the specificity of a gene in HCCs compared with other tumor types:

The positive value means high specificity and negative value means low specificity.
Prognostic analysis
The prognostic performance of each gene was measured in three datasets (HCCDB6, 15, 18) with overall survival times. In each dataset, HCC samples were classified into high-/low-expression groups by median expression value of each gene. Then log-rank test was taken to compare the survival distributions of samples in two groups. Genes with adjusted P < 0.001 (Benjamini-Hochberg correction) in at least one dataset or adjusted P < 0.01 in at least two datasets were identified as prognostic genes. These genes were tagged as "favorable genes" if their cox coefficients were negative, which meant the higher expression levels, the lower risk extents. Conversely, they were tagged as "unfavorable genes" if their cox coefficients were positive.
To reduce the noise of disease irrelevant deaths, survival time that was greater than five years was truncated to five years and the status of the corresponding patient was set to be "alive".
Co-expression analysis
For each gene, we computed and displayed its co-expressed genes in HCC, adjacent samples and normal liver, respectively. In each dataset, following steps were taken. The 10% genes with smallest expression variances were excluded to reduce noises. The function cor.test in R was taken to compute the Pearson correlations between each of the remaining genes (pivot) and all the other genes and, meanwhile, test the significances, followed by Benjamini-Hochberg correction. For each gene (pivot), its significantly co-expressed genes (candidates) in a certain dataset were detected as ones with adjusted P < 0.001. For co-expression in normal liver (GTEx liver samples), we picked the top 20 strongest co-expressed genes to display on the website. For co-expression in HCC/adjacent samples, we combined multiple datasets to give a robust result. Suppose one pivot gene had a candidate gene detected out in k datasets. If k < 3, the co-expression relationship would be thought to be unstable and excluded in downstream analysis. For pivot genes with stable co-expression relationships existing (k >= 3), their candidates’ correlation values were combined with Fisher’s z- transformation if the candidate was detected in at least one third of k datasets:
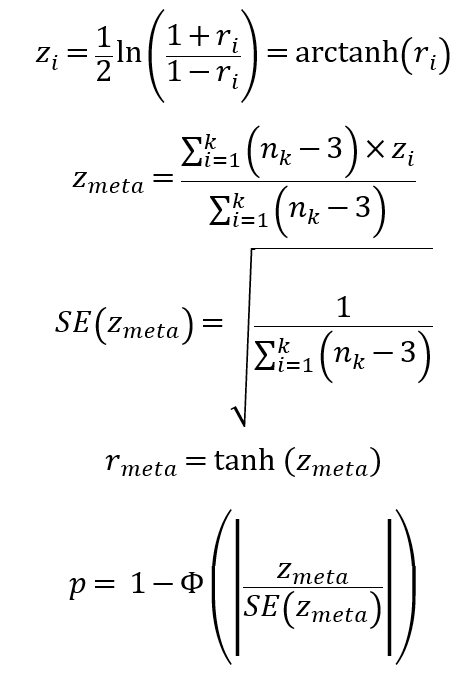
where i was the index of dataset and n_i was the sample size . By this way, for each pivot gene, we could get its consistently co-expressed genes in multiple HCC or adjacent datasets. Also, only the top 20 strongest ones were displayed on the website.